 |
| Created by Customer Magnetism. |
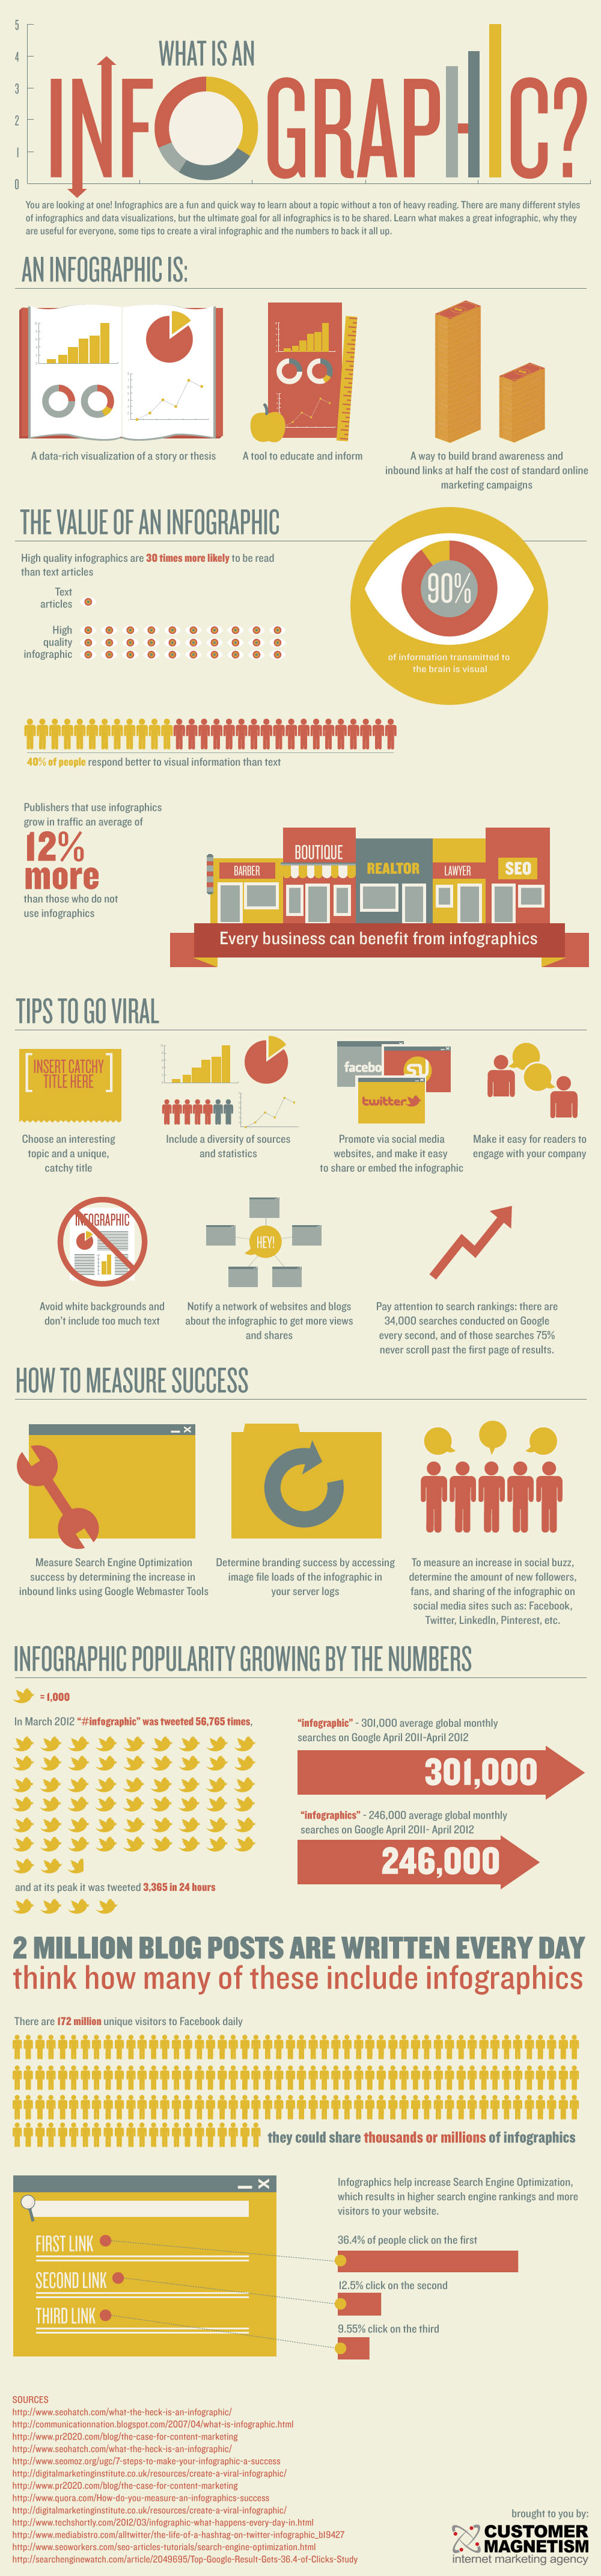
An infographic is short for information graphic which is a visual image such as a chart or diagram used to represent information or data. According to the social network Digg, since 2007 infographics have
increased by 250 times. The popularity of infographics seems to be growing as it is a way to visually relay a lot of information that is consumed quickly by an audience. 90% of the information that comes to the brain is received and processed visually, which proves the effectiveness of infographics and why companies are turning to graphics to market and share information.
People are 44% more likely to interact with a brand who posts images on social media . Infographics allow companies to share information in ways that are:
People are 44% more likely to interact with a brand who posts images on social media . Infographics allow companies to share information in ways that are:
- Easy to understand
- Grab your attention
- Easy to share
- Shows an expert understanding of a subject
- Increases traffic
It is important to make sure that when creating an infographic however, that design is key. Keeping in mind visual appeal and consistency can make an infographic more effective. As a creator of an infographic you want do keep in mind colors, fonts, and images. An infographic that is cluttered and hard to follow is ineffective and will confuse the audience.

In general, I believe most people are more drawn to images than text. I've noticed heavier use of infographics over the last year or so, and I'm sure this increase began with the increasing popularity of social media. However, as you stated, design is very important because the infographic must convey it's meaning from the viewers first glimpse. It's pointless if it doesn't catch the viewers eye in a good way. There are many articles out there and websites to help people create visually appealing websites and infographics. Having an understanding of what colors, layout, and overall design will be most visually appealing is very important for designers to create successful infographics. Great blog, very interesting!
ReplyDeleteI think that it is really interesting to see the results of things by way of graphs and charts through statistics. I like to see how people think and what they like. It takes a lot of time and data to put together an infographic, but with infographics, they allow companies to share information in many ways, grab your attention, and increase traffic to their company’s website all at the same time.
ReplyDelete